The Challenge of Isolated Data
At the heart of every modern company beats a constant pulse of data. Every sale, every purchase, every customer interaction, every hour invested in a project, and every inventory movement generates information. Yet in most organizations, this pulse is chaotic and arrhythmic. Data exists, but it is trapped in spreadsheets, disconnected systems, and static reports. The real challenge is not the lack of information, but the overwhelming inability to turn your data into strategic decisions that drive growth and agility.
Many organizations, maybe even yours, still operate under the tyranny of manual reports. Monday mornings become a race against time to consolidate spreadsheets. Executive teams attend meetings with numbers that don’t match, and critical decisions are postponed while “someone prepares the report.” This practice is inefficient, error-prone, and keeps the company anchored in the past—reacting to what already happened instead of anticipating what’s next.
The key to leading in today’s market is building a data-driven culture. That is only possible when tools democratize access to information. The answer lies in interactive dashboards and reports, natively integrated into your ERP like Acumatica, that allow every leader and every team to visualize what truly matters in real time, from a single, reliable source of truth.
The High Cost of Disconnected Data
Hidden Inefficiency
An isolated number means nothing without context. Sales this month say little until compared with budget, with the prior month, or broken down by region, salesperson, or product line. When this context depends on manual processes, the company absorbs hidden costs.
Think about time. If five managers spend three hours each week consolidating Excel data, that’s 15 hours a week, 60 hours a month, and nearly two full work weeks of a qualified employee every year wasted on a task that technology should automate. Time that should be invested in strategy, innovation, and leadership.
Risk and Unreliability
Manual processes invite human error. A copied formula, a wrong filter, or a typo can have catastrophic consequences: incorrect inventory orders, unprofitable pricing, or flawed financial projections. When decisions rely on fragile data, the company’s strategy itself becomes fragile.
Decisions Based on the Past
Manual reports are always snapshots of yesterday. By the time they’re compiled, the market has moved: a competitor launched a new offer, a key client raised an issue, or a supply chain suffered a delay. Operating with outdated information is like driving only with the rearview mirror—you only see the risks after you’ve passed them.
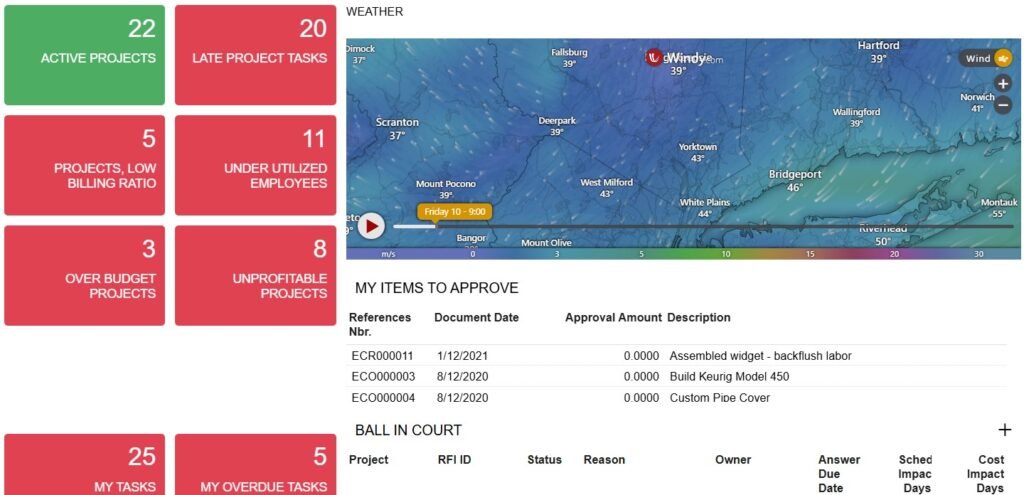
Dashboards in Acumatica: Your Business on One Screen
This is where Acumatica ERP, implemented with KALM Consulting’s expertise, changes the game. A well-designed dashboard is not just visual decoration—it’s the strategic control center of your organization and a key enabler to turn your data into strategic decisions.
Benefits at a Glance
- 360° Real-Time View: From gross margin to pending purchase orders to sales team quotas—all in one place.
- Interactivity and Autonomy: Filter and drill down with a few clicks, no need to request new reports.
- Consistency and a Single Source of Truth: Everyone works with the same live data. No more debates over “who has the right number.”
- Security and Role-Based Access: Each user sees only the data relevant to their role.
The power of Acumatica dashboards lies in their native integration. No costly, complex BI tools. Data is live, reliable, and comes directly from the source—helping you make faster and more confident decisions.
The KALM Method for Impactful Dashboards
At KALM, we don’t just implement software—we build strategic solutions that help you turn your data into strategic decisions. Our proven methodology ensures every dashboard delivers measurable business value.
Phase 1: Strategic Discovery
We ask the right questions:
“What decisions do you need to make daily?”
“What questions keep you up at night?”
Then we connect strategic goals (e.g., “increase profitability by 10%”) to tactical KPIs (e.g., “margin per product line,” “customer acquisition cost”).
Phase 2: Design and Data Storytelling
A good dashboard tells a story. We design prototypes that guide the user from the big picture down to detail. Line charts for trends, bar charts for comparisons, gauges for goals—every visualization is chosen for instant clarity.
Phase 3: Technical Implementation
Using Acumatica’s tools like Generic Inquiries, we configure data models, KPIs, and widgets to ensure dashboards are accurate, automated, and lightning fast.
Phase 4: Training and Adoption
Finally, we empower your teams. We don’t just train on features—we teach analytical thinking. Teams learn to ask better questions, recognize trends, and turn insights into action.
Real-World Scenarios You’ll Recognize
The Sales Director Who Spends Mondays in Excel
Instead of starting the week with outdated spreadsheets, imagine opening Acumatica and instantly seeing a live dashboard: sales heatmaps by region, rep performance, pipeline by stage, and product trends.
With KALM, your Monday morning turns into a strategic coaching session instead of a reporting marathon.
The CFO Who Lives With Uncertainty
If your finance team relies on fragile spreadsheets for cash flow projections, you’re not alone. With a financial dashboard in Acumatica, you can monitor daily cash position, AR aging with visual alerts, EBITDA, and real-time budget comparisons—all in one place.
That means anticipating liquidity needs weeks ahead, not guessing at the last minute.
The Operations Manager Who Battles Stockouts
If you’re constantly fighting stockouts on raw materials while carrying excess finished goods, a logistics dashboard can help. With visibility into warehouse-level stock, product rotation days, pending POs, and supplier delivery performance, you can reduce shortages, free up working capital, and run operations with confidence.
It’s Time to Turn Your Data Into Your Strongest Asset
Data on its own is just noise. Its true value emerges when structured, contextualized, and presented to illuminate the path forward. Technology’s purpose is not to accumulate information but to provide the clarity to make better, faster decisions.
With KALM’s proven methodology, an Acumatica dashboard is not a luxury—it is an indispensable management tool to compete and thrive in today’s unforgiving market. It’s the shift from driving with the rearview mirror to steering with a clear windshield.
At KALM Consulting, our mission is to help your data come alive and fuel your company’s growth.
👉 Book a free consultation with our Acumatica experts today and discover how the right dashboards can transform your business.
With KALM in Acumatica, your data comes to life—and helps you turn your data into strategic decisions that truly move your business forward.